How Life Insurance Works: From First Principles to Permanent Coverage
Updated:

Table of contents
- 1. How is life insurance different from other insurance?
- 2. Why don't insurers just charge the yearly cost of insuring you?
- 3. Reference Table: How the Natural Cost of Insurance Increases with Age
- 4. Why does permanent life insurance need a cash value?
- 5. What is the net amount at risk (NAR)?
- 6. What does whole life insurance cost?
- 7. Summary Comparison: Term vs. Whole Life
To understand how modern permanent life insurance operates, it helps to set aside marketing pitches and look at the underlying mathematics. Insurance, at its core, is simply a way to share financial risk. However, life insurance works differently from almost every other type of policy you buy.
1. How is life insurance different from other insurance?
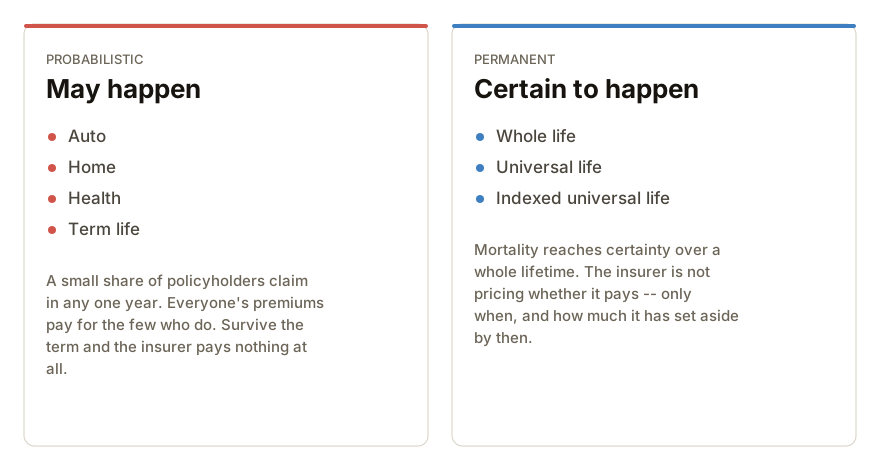
Most insurance pays for something that may never happen; permanent life insurance pays for something certain to happen: death.
Think about the insurance policies you buy every day:
- Auto Insurance: Covers the risk of a car accident. Most drivers will not crash their car in any given year.
- Homeowners Insurance: Covers the risk of a house fire or storm damage. The vast majority of homes never burn down.
- Health Insurance: Covers medical treatment for illnesses or injuries that may or may not happen to a specific person in a given year.
All of these are probabilistic insurance policies. They protect against events that might happen. Because only a small percentage of policyholders will file a claim in any single year, the insurance company collects modest premiums from everyone to pay for the few people who suffer a loss.
Life insurance comes in two primary forms:
- Term Life Insurance: Works just like auto or health insurance. It covers a specific timeframe (such as 10, 20, or 30 years). If you die during that window, it pays. If you survive past the end date, the coverage ends, and the insurance company pays nothing.
- Permanent Life Insurance: Stays active for your entire lifetime. Because human mortality reaches a 100% probability over a long enough horizon, the insurance company knows with absolute certainty that it will eventually pay out the death benefit, provided the policy stays active.
2. Why don't insurers just charge the yearly cost of insuring you?
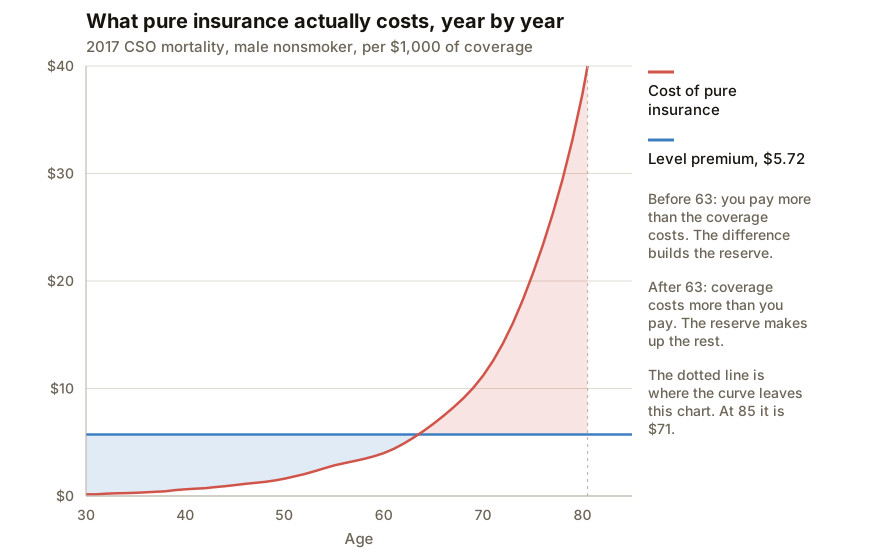
Because that cost climbs steeply with age. For $500,000 of coverage, the pure cost of insurance is about $80 for the year at age 30, $18,690 at 80 and $67,850 at 90 (2017 CSO mortality, male nonsmoker), before the insurer adds anything for its own costs.
As we age, our statistical likelihood of dying in any given year goes up. In insurance terms, this annual likelihood is called the Mortality Rate.
- When you are 25 years old, your annual risk of dying is very small, so pure coverage is extremely inexpensive.
- When you are 85 years old, your annual risk of dying is much higher, making pure coverage very expensive.
Charged that way, year by year, the bill would be close to nothing in your 20s and 30s. By 90, a single year of coverage would cost about 14% of the death benefit itself, just to keep the policy in force.
3. Reference Table: How the Natural Cost of Insurance Increases with Age
To see how fast pure insurance charges grow, insurers use mortality tables. The figures below come from the 2017 CSO table, the standard mortality basis US insurers are required to use, for a male nonsmoker who bought the policy at 30. They are unloaded rates — the table's best estimate of actual mortality, with no margin for the insurer's expenses, profit or caution added on top. A real policy charges more than this.
| Age | Chance of dying that year | Cost of pure insurance (per $1,000) | Annual pure cost, $500,000 of coverage |
|---|---|---|---|
| 30 | 0.016% | $0.16 | $80 |
| 40 | 0.062% | $0.62 | $310 |
| 50 | 0.161% | $1.61 | $805 |
| 60 | 0.399% | $3.99 | $1,995 |
| 70 | 1.120% | $11.20 | $5,600 |
| 80 | 3.738% | $37.38 | $18,690 |
| 90 | 13.570% | $135.70 | $67,850 |
Read the last column as a bill. Insuring a healthy 30-year-old for $500,000 costs about $80 for the year. Insuring the same person at 90 costs about $67,850 — roughly 850 times as much, for exactly the same coverage. And that is before the insurer adds anything for running the company.
Because the pure cost of coverage becomes so high at older ages, a permanent policy cannot rely on year-to-year pricing alone. It needs a mechanism to cushion those rising costs.
4. Why does permanent life insurance need a cash value?
A permanent policy charges the same premium every year, even though the cost of insuring you rises every year. So in your early years you pay more than your insurance actually costs, and the extra is saved inside the policy as cash value. In later years, when the yearly cost of insurance grows larger than your premium, the policy spends that saved cash value to make up the shortfall. Without it, the premium could not stay level.
That fixed yearly price is called a level premium, and it keeps your bill predictable for the rest of your life.
To make a level premium work mathematically:
- You overpay relative to the actual cost of insurance during your younger years: on the chart in section 2, until about age 63, for a level premium of $5.72 per $1,000 of coverage a year.
- The extra money you pay early on is put into a growth pool called the Cash Value (CV).
- In your later years, when the actual cost of insurance climbs higher than your level premium, the policy draws from that accumulated Cash Value pool to make up the difference.
5. What is the net amount at risk (NAR)?
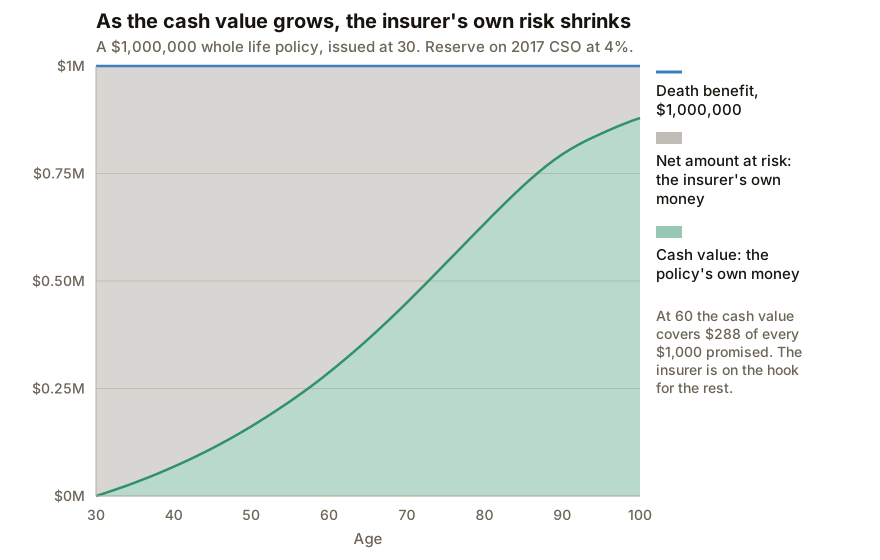
The net amount at risk is the part of the death benefit the insurer pays out of its own money. When you die, part of the death benefit is really your own cash value, the money you overpaid over the years, handed back to your beneficiaries. Only the rest, the death benefit minus the cash value, comes out of the insurer's pocket.
To understand how the Cash Value protects the policy in old age, we look at how much money the insurance company actually puts on the line.
Every permanent policy has two main financial figures:
- Total Death Benefit: The full payout promised to your beneficiaries (e.g., $1,000,000).
- Cash Value (CV): The money built up inside the policy over time.
Written as a formula:
How Cash Value Slows the Rising Cost
When a policyholder passes away, the insurance company pays out the full Death Benefit. However, part of that payout comes directly from the policy’s accumulated Cash Value. The insurance company only has to cover the remaining balance out of its own funds. That remaining balance is the Net Amount at Risk (NAR).
As you get older, two factors balance each other out:
- The cost of pure insurance per thousand dollars goes UP (because you are older).
- The number of thousand-dollar units the company needs to insure goes DOWN (because your Cash Value has grown, reducing the Net Amount at Risk).
Because the internal insurance charge is calculated as:
A rising mortality rate multiplied by a shrinking Net Amount at Risk pulls in two directions, and the shrinking side takes a great deal of the sting out. It does not cancel it. On the policy drawn above, per $1,000 of death benefit:
| Age | Mortality rate | Net amount at risk | Internal charge |
|---|---|---|---|
| 30 | 0.016% | $1,000 | $0.16 |
| 50 | 0.161% | $838 | $1.35 |
| 70 | 1.120% | $550 | $6.16 |
| 90 | 13.570% | $205 | $27.88 |
Between 30 and 90 the raw mortality rate rises about 850 times. The internal charge rises about 170 times. The growing cash value absorbs roughly a fivefold difference — real, and not nearly enough on its own to hold the cost flat.
So what actually keeps your bill level is not a flat internal charge. It is the reserve: the money you overpaid in your thirties and forties, sitting inside the policy and earning interest, ready to pay the difference once the charges outgrow the premium. The shrinking net amount at risk is what makes that reserve large enough to do the job.
6. What does whole life insurance cost?
For a healthy 30-year-old man, $500,000 of whole life insurance costs about $5,700 a year in the best health class [1], and about $4,400 in average health [2]: a larger commitment than term coverage.
Because Whole Life insurance provides a guaranteed death benefit along with guaranteed cash value growth and fixed premiums, it requires a larger financial commitment than temporary term coverage.
Here are the ranges typically quoted around a $500,000 Whole Life Policy, to give you a sense of scale. They are not a quote and not a table we computed — a real one depends on the carrier, the product and what the underwriter makes of your medical history.
Example A: The Healthy 30-Year-Old (Preferred Plus Health)
- Gender: Male
- Health Status: Excellent (non-smoker, great family history)
- Typically quoted around: $5,000 – $6,500 / year [1]
- Why: Because this person starts young, the insurance company has decades to collect premiums and compound the internal Cash Value before mortality costs begin to climb.
Example B: The 30-Year-Old with Standard Health
- Gender: Male
- Health Status: Average (minor health history or elevated cholesterol)
- Typically quoted around: more than Example A, by an amount that depends on the insurer's underwriting
- Why: Slightly higher health risks mean the insurer builds higher risk protections into the baseline cost.
Example C: The Healthy 50-Year-Old (Preferred Plus Health)
- Gender: Male
- Health Status: Excellent
- Typically quoted around: $10,000 – $13,000 / year [1] [2]
- Why: Starting at age 50 gives early overpayment fewer years to compound. The insurer faces higher near-term mortality risk, requiring a significantly larger annual premium to maintain level costs for life.
Sources. [1] Policygenius, "Average Whole Life Insurance Rates", updated October 1, 2024: $472 a month for a 30-year-old man who does not smoke, in the Preferred Plus class, for $500,000 of whole life paid up at 100, and $1,081 a month for a 50-year-old man. [2] MoneyGeek, "How Much Is a $500,000 Life Insurance Policy?", updated September 22, 2026: $370 a month for a 30-year-old man who does not smoke, in average health, and $862 a month for a 50-year-old man.
Key Characteristic: Rigidity
Traditional Whole Life policies are inflexible:
- Your premium payment is fixed. You must pay the exact same dollar amount on schedule every year.
- If you skip payments or pay less than required, the policy can drop its guarantees or use accumulated cash value to cover the bill until the cash runs out.
Our article on how life insurance evolved examines how modern Universal Life (UL) policies split these components apart to give policyholders flexible control over their payments and cash value growth.
7. Summary Comparison: Term vs. Whole Life
| Feature | Term Life Insurance | Traditional Whole Life Insurance |
|---|---|---|
| Primary Purpose | Temporary income replacement | Lifetime protection & estate legacy |
| Payout Expectation | Only if death occurs during term | Guaranteed 100% payout upon death |
| Policy Duration | 10, 20, or 30 years | Lifetime (up to age 100/121) |
| Cash Value Growth | None ($0) | Guaranteed minimum, set in the contract |
| Insurer Risk (NAR) | Full face amount throughout term | Decreases as Cash Value grows |
| Payment Flexibility | Fixed level premium during term | Fixed level premium for life (rigid) |
Everything above is how the machinery is supposed to work. Whether your own policy's numbers actually behave that way is a different question, and the only document that can answer it is the illustration you were handed.
Have your own illustration read
Drop the PDF in and we will tell you how the policy works. The diagnostic is free.
For the easiest experience, complete your analysis on a computer.
Drop your illustration here
or click to choose a PDF, up to 25MB