How Much Can You Actually Borrow From an Indexed Universal Life (IUL) Policy? A Case Study
Updated:

The appeal of an IUL loan is easy to state: the money comes out tax-free, there is no repayment schedule, and the policy keeps growing behind it. Our article on how IUL loans work covers how that works and what it costs.
This one is about a narrower question. How much?
A typical illustration sent by your agent does not tell you exactly that. What you can safely borrow is smaller than what is in the account, sometimes by a lot, and it depends on something you cannot see from the illustration or annual statement at all. Some illustrations do show you the case where you can borrow a large amount at a certain age and still keep the policy intact till age 100 or beyond, and you can easily ask your agent to produce one, but it is still not quite as reassuring — what if the market doesn't behave as optimistically as the illustration has assumed?
Why is "how much can I borrow" a lifetime question?
If you borrow from a policy and the policy later runs out of money, the coverage ends — and the loan you never repaid turns into taxable income in that year, with no cash value remaining to pay the tax from. That is the failure mode one absolutely needs to avoid.
Which means a policy loan is only as safe as the policy is long-lived. Borrowing an amount the policy can realistically sustain for 10 years is not useful if you will live for another 20 years. So the question is not "how much will the cash value in my policy accumulate to." It is:
What is the largest amount I could take out and still have this policy standing for the rest of my life?
That is a question you can only answer by running the policy forward and looking.
What we ran
We did a case study — we looked at the policy for a young male adult who does not smoke, with $500,000 of initial coverage, aggressively funded in the first 4 years and then left alone with no more premium contributions — totaling about $110k of payments. This front-loaded pattern is the max-funded design (a.k.a. 'accumulator'), where one contributes the maximum in the shortest timeframe possible without the policy becoming a MEC (modified endowment contract) under IRS rules, which keeps borrowing tax-free later on; this has the benefit of minimizing the annual cost of insurance, because the NAR (net amount at risk) has been minimized for every year onward, giving one the most leverage over their accumulated cash value.
Then we put it through 12 different markets: strong ones, weak ones, markets that swing violently in both directions, a market that does not grow at all, a crash early on, a crash in the middle, a crash near the end, a decade that goes nowhere, two crashes in one lifetime, and the S&P 500's own real years. See our detailed methodology in this article.
For each of those markets we asked, for every year from age 60 onward, the same question: if I were to borrow from this policy once, at this given year, and never touch it again, what would be the maximum it could lend me while still remaining in force at age 100, so that I would not incur a huge tax bill later due to the policy lapsing? Because we have simulated market data for each market condition for however many years we want, this maximum can be easily modeled. We picked age 60 because one typically uses their IUL policy for retirement income, tax-free. Carriers do not let you borrow the whole account (or else the policy lapses immediately) — we assume a maximum of 95% one can borrow from their cash value for simplicity, whereas in reality this might differ slightly between carriers. The results will therefore land somewhere between 0% and 95%.
Two things to know about the answer before you read it. For stress-test purposes, we report the worst year after age 60 in each market we test, and its corresponding percentage, not an average or median one, because a plan to borrow has to survive its worst moment. It is entirely possible that you may be able to borrow 95% at age 60 safely, but if you wait till age 70, you can only borrow 70% of the accumulated cash value then, because the market might experience a crash in the following decade(s), forcing you to keep a larger cushion. Additionally, we assume a wash loan, the kind that costs no net interest to borrow. Insurers sometimes offer an 'alternative loan' which we do not model here.
The policy also offers two index accounts, and we ran the test on each. The capped account credits the index's gain each year up to 10.5%. The uncapped account has no limit, but it takes a 5.5% spread off every year's gain first. Both credit 0% in a year the index falls. As you will see, the two accounts give very different answers.
How much can you borrow from an IUL in most markets? About 94%, on the uncapped account
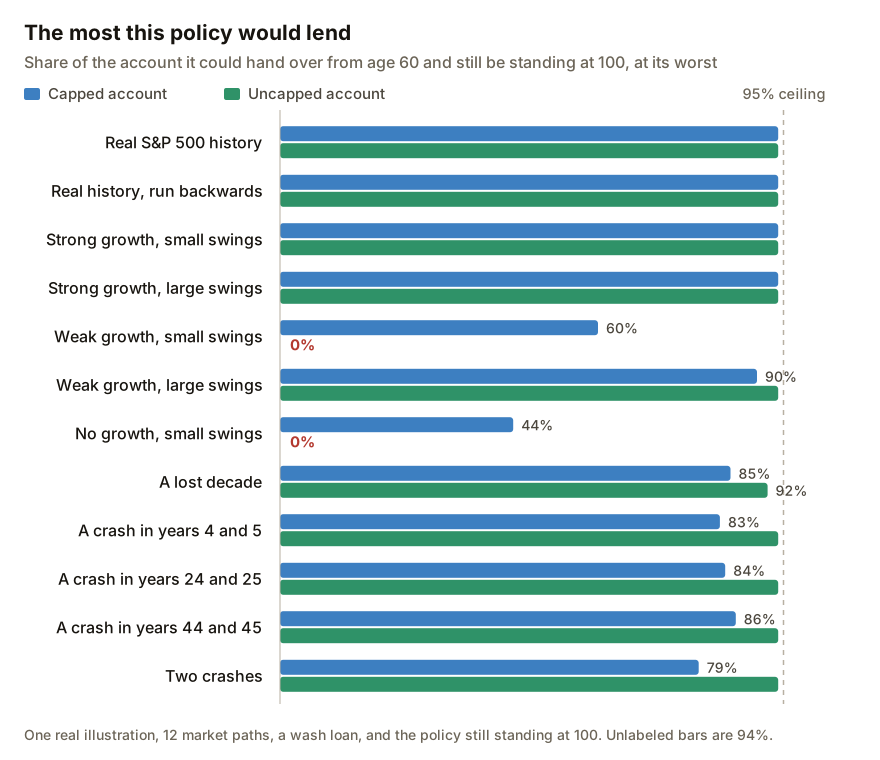
In 9 of the 12 markets, the uncapped account would hand over 94% of the account, a point under the 95% ceiling, and still be standing at 100.
That includes every crash we threw at it. A crash in the early years, a crash midway through, a crash near the end, two crashes in the same lifetime — all 94%. A decade that ends where it began comes in at 92%. It includes the run on the S&P 500's own history, which is also 94%.
If you stopped reading here you would conclude that the loan is essentially as large as the carrier will allow, whatever the market does. For 10 of the 12, that is true.
Can the safe loan from an IUL fall to nothing? In two markets, yes
In a weak market with small swings, and in a market that does not grow at all, the uncapped account's answer falls to nothing. Not a smaller loan — nothing.
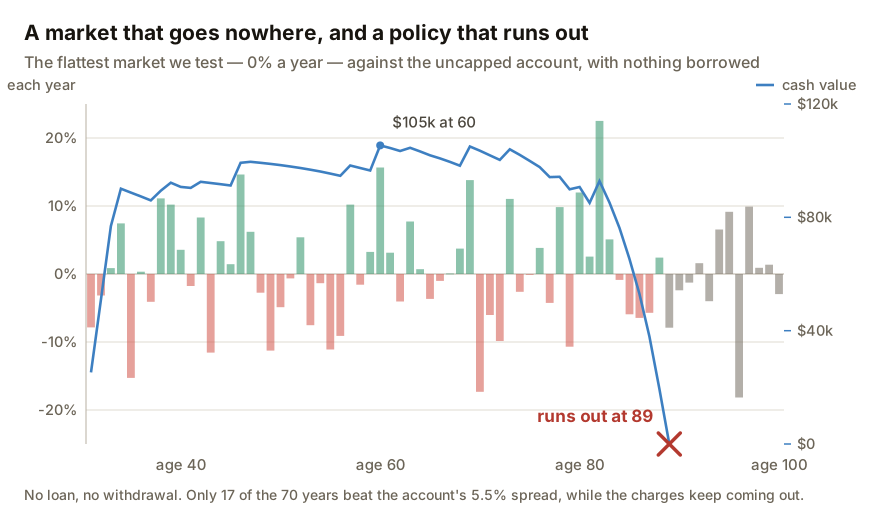
The reason is not that the loan is refused. On the two flattest markets we run, the policy runs out of money by itself — at 89 in the market that does not grow and at 93 in the weak one — with nothing borrowed at all. On those two, there is no year from 60 onward where it can lend anything and still reach 100, because by then the policy no longer exists to borrow against.
This is worth noting, because it is not the typical risk — a crash — that most people brace for.
A crash is survivable. The floor means a bad year credits zero instead of a loss, and afterwards the market comes back — and those recovery years credit right up to the cap and refill the account. The policy takes the hit and keeps going.
A market that goes nowhere, as shown above, never comes back, because it never falls. It simply credits nothing, year after year, while the charges keep coming out and the cost of covering you keeps climbing with your age. Nothing dramatic happens. The account just drains.
On the uncapped account, the spread is what does the draining. A year credits something only when the index gains more than 5.5%, and in the market that does not grow, 17 of the 70 years did.
The capped account survives the weak market with small swings and the market that does not grow, because it credits every up year in full, to 10.5%. In the market that does not grow, about half the years go up, and those years are enough to carry the policy to 100. Surviving still costs the capped account something. At its worst, the capped account would lend 44% of the account in the market that does not grow, 60% in the weak market with small swings, and 79% to 86% through the crashes and the lost decade. Which account you hold changes both how much you can borrow and which market threatens the loan.
So the scenario that ends an IUL loan is not the one that would end a margin loan on a stock portfolio. Crashes are protected by IUL's floor, but a long stretch of quietness is eroded by IUL's annual charges and management fees.
What to take from this
This is one policy, not a rule. These figures are what this illustration did on these 12 markets. Yours is a different contract with different charges and a different cap, and it will give a different answer.
But the shape of the finding is likely to travel, and it suggests two questions worth asking about your own:
- Does the policy stay in force to 100 with nothing borrowed, in a market that credits close to nothing for a long stretch? If it does not, the loan you are being shown was never available.
- What does the safe loan look like in the years you actually plan to borrow — not on the illustration's headline path, but on its worst one?
Neither is on the front page of an illustration. Both are answerable from the numbers inside it.
And even more caveats worth calling out
Everything above is one 30-year-old man who does not smoke, on an accumulator design funded in 4 years and not after. Every one of these parameters works in the loan's favor.
The health class is settled when the policy is issued. The illustration prints a cost-of-insurance charge for every one of the contract's 90 years, from age 31 to age 120 — $76 in the first year and $1,022 at 80 on the illustrated path. The rates behind those charges are set by the health class the policy was issued at, and they are not repriced later because the owner's health changed. Being 30 at issue means those charges stay small for decades before they start to climb. And paying the whole premium in the first 4 years gives the cash value the longest run of compounding it can have before anything is borrowed against it.
Move any one of them the wrong way — an older insured, a health class that is not the best one, a smoker's rates, or a policy funded nearer the minimum than the maximum — and the same test can come back with a much smaller safe loan margin, or with nothing. What the numbers in this case study show is what this design does under these markets, and the max-funded design does its job to one's satisfaction — it withstands most market conditions one can reasonably expect, allowing one to safely borrow close to the max 95% at any age they wish. This is certainly not what every IUL policy might allow in general.
How much your own IUL contract allows you to borrow is answerable — upload and we flag any borrowing risk for free:
Have your own illustration read
Drop the PDF in and we will run this same test on your own policy — your age, your health class, your funding — and tell you the largest loan it could carry to 100, in every year, across every market we test, and the years where that figure falls away.
For the easiest experience, complete your analysis on a computer.
Drop your illustration here
or click to choose a PDF, up to 25MB