Why Can an Indexed Universal Life (IUL) Death Benefit Increase? Understanding the Cash Value Corridor
Updated:

Table of contents
- What is the cash value corridor in an IUL?
- Why does an IUL need a corridor?
- How can the corridor make a level death benefit increase?
- Does this mean the policy changed from level to increasing?
- Why does the corridor percentage decline as I get older?
- How does a declining corridor affect the cost of my insurance?
- Why might a death benefit increase and then stop increasing?
- What does the corridor do on a real illustration?
- Is the corridor the same as an increasing death-benefit option?
- Do the corridor rules apply to an increasing death benefit too?
- Does the corridor increase my life insurance costs?
- Why does the corridor matter when evaluating an IUL for cash accumulation?
- How can I tell if the corridor is affecting my IUL illustration?
- Does a larger corridor-driven death benefit mean I am getting more value?
- The bottom line
You may look at an IUL illustration and see something surprising:
The policy has a level death benefit, yet the projected death benefit eventually starts increasing.
Why?
The answer is usually the cash value corridor.
The corridor is one of the less intuitive parts of an IUL because it can cause a policy's death benefit to increase even when the owner did not choose an increasing death-benefit option.
What is the cash value corridor in an IUL?
The cash value corridor is a tax-law requirement that limits how large the cash value can become relative to the policy's death benefit while the contract continues to qualify as life insurance under Internal Revenue Code §7702.
In simplified terms:
Minimum death benefit = cash value × applicable corridor percentage
The applicable percentage depends on the insured's age.
The important consequence is that the death benefit cannot become too close to the policy's cash value.
Why does an IUL need a corridor?
Because the tax advantages a policy gets are meant for life insurance, and the corridor makes sure every policy that gets them carries a real amount of it.
Without rules like the corridor, a policy could potentially accumulate a large amount of cash value while providing only a very small amount of life insurance.
At some point, that would look more like an investment account than life insurance.
Here is why that matters. The cash value inside a life insurance policy grows without being taxed each year, and a death benefit paid to your beneficiaries is generally not taxed as income. An ordinary investment account gets neither: you owe tax on its dividends and on the gains you realize as you go.
What a policy normally pays for those advantages is the cost of insurance. The insurer charges it on the net amount at risk, the part of the death benefit above your cash value. A policy whose death benefit is barely larger than its cash value has a tiny net amount at risk, so it pays almost nothing for insurance. Without a limit, someone could put a large sum into a policy that carries almost no insurance, pay almost no insurance charges, and still let all of it grow untaxed: a tax shelter with a life insurance label on it.
The corridor closes that gap. By requiring the death benefit to stay a set percentage above the cash value, it keeps a real amount of insurance in force, and with it a real cost of insurance.
Section 7702 therefore establishes requirements that a contract must satisfy to receive life-insurance tax treatment.
The corridor is one part of those requirements.
How can the corridor make a level death benefit increase?
Once the cash value grows large enough that the corridor percentage times the cash value exceeds the specified amount, the death benefit has to rise to that minimum.
Consider a simplified example.
Suppose you have:
Specified amount: $500,000
Cash value: $150,000
If the applicable corridor requires a death benefit of at least $375,000, the $500,000 specified amount is sufficient.
So:
Death benefit = $500,000
Now suppose the cash value grows to $250,000 while the same corridor percentage applies.
If the minimum required death benefit is now $625,000:
$250,000 × 250% = $625,000
The original $500,000 death benefit is no longer sufficient.
The policy therefore needs a higher death benefit to satisfy the corridor.
This is why a level death benefit can eventually begin increasing.
Does this mean the policy changed from level to increasing?
No. The option stays level; the corridor only sets a minimum under the death benefit, as a tax requirement.
This distinction is important.
An increasing death-benefit option intentionally incorporates cash value into the death benefit.
A level death-benefit option generally tries to keep the death benefit around the specified amount, but it cannot fall below the applicable statutory corridor requirement.
So the death benefit can be thought of as being subject to two different concepts:
The contractual death-benefit option determines the intended structure.
The corridor establishes a minimum death benefit required by the tax rules.
The corridor can therefore override the otherwise-level trajectory when necessary.
Why does the corridor percentage decline as I get older?
Because the tax code's table sets it that way: Section 7702(d) lowers the percentage at each age, down to 100% at 95.
The statutory corridor percentage decreases with age.
The broad schedule begins at a much higher percentage for younger insureds and gradually declines, eventually reaching 100% at age 95. For example, the applicable percentage is 250% through age 40, 185% at age 50, 150% at age 55, 130% at age 60, and 120% at age 65 [1].
The exact schedule contains intermediate ages, so these figures should be viewed as examples rather than a complete table.
Which policies these percentages apply to. Section 7702 gives a policy two ways to qualify as life insurance. The corridor and its table are part of one of them, the guideline premium test; a policy can instead qualify under the cash value accumulation test, which works differently and does not use this table. The ages in the table are the insured's age at the start of each policy year, which can be one less than the age an illustration prints beside that year.
Source. [1] 26 U.S. Code § 7702, subsections (a) and (d), Cornell Law School's Legal Information Institute: a contract qualifies by meeting the cash value accumulation test, or by meeting the guideline premium requirements and falling within the cash value corridor, and the corridor's table runs from 250% through age 40 to 100% at 95.
The practical idea is simple:
Younger age → higher required death benefit relative to cash value
Older age → lower required death benefit relative to cash value
How does a declining corridor affect the cost of my insurance?
When the corridor is setting your death benefit, a falling percentage pulls your cost of insurance down: the same cash value requires a smaller death benefit, so the policy carries less insurance above its cash value, and that is the amount the cost of insurance is charged on. The rate charged per $1,000 of that insurance rises with age, though, so the charge itself does not necessarily fall.
Suppose your cash value is $300,000.
At a 150% corridor:
Minimum death benefit = $450,000
But at a 120% corridor:
Minimum death benefit = $360,000
The required death benefit has fallen even though the cash value stayed exactly the same.
This creates an interesting interaction inside an IUL:
- cash-value growth pushes the required death benefit upward;
- aging pushes the corridor percentage downward.
Which effect dominates at a particular point depends on the policy's values and the insured's age.
At the very end, the percentage wins outright. On the real illustration below, the corridor reaches 100% at 95, the death benefit becomes equal to the cash value, no insurance remains above it, and from then on the illustration charges no cost of insurance at all.
Why might a death benefit increase and then stop increasing?
Because both cash value and the corridor percentage are changing.
Imagine that cash value grows rapidly while the insured is relatively young. The increasing cash value may push the corridor requirement upward faster than the corridor percentage is declining.
Later, the insured becomes older and the corridor percentage becomes smaller.
The specified amount may then once again be sufficient to satisfy the corridor.
So the death benefit trajectory can change over time.
This is why it is useful to examine the death benefit year by year rather than looking only at the final illustration year.
What does the corridor do on a real illustration?
On one real illustration, the corridor started setting the death benefit at age 50 and never stopped.
The illustration is for a 30-year-old man who does not smoke, with a level death benefit of $500,000 and about $101,000 of premiums paid over the first 4 years. Every number below is printed in the illustration itself, at its illustrated rate.
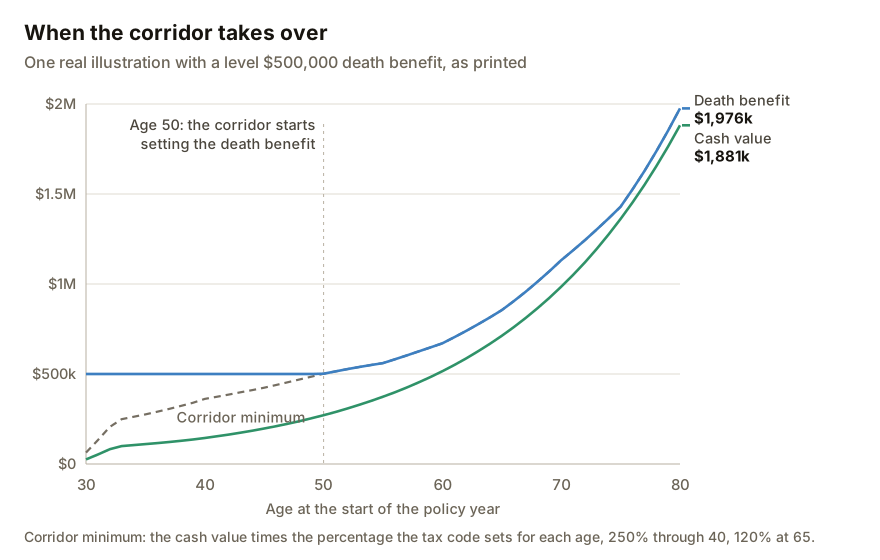
As shown above, the death benefit stays at $500,000 for 20 years while the cash value grows underneath it. In the policy year that starts at age 50, 185% of the cash value, the corridor percentage for that age, first comes to more than $500,000, and that is exactly the death benefit the illustration prints. From then on, the printed death benefit is the cash value times the corridor percentage in every year: 120% at 65 and 105% at 80.
On this policy, the death benefit never stops increasing, the way the section above says it can. Its cash value grows faster than the corridor percentage falls, so the $500,000 specified amount is never enough again. A policy funded less heavily, or credited at a lower rate, could look different.
Is the corridor the same as an increasing death-benefit option?
No. An increasing death benefit is an option you choose, and it adds the cash value to the death benefit every year; the corridor is a tax-law minimum that lifts a death benefit only when the cash value grows large enough.
They can produce superficially similar results, but they work differently.
| Increasing death benefit | Cash value corridor | |
|---|---|---|
| Why does DB increase? | Contractual death-benefit design | Tax-law minimum |
| Relationship to cash value | Generally intentionally tied to CV | Sets a minimum DB/CV relationship |
| Applies because of | Policy option | Federal tax rules |
| Can affect a level option? | Not applicable | Yes |
| Changes with age? | Depends on policy | Yes |
This distinction is especially important when reading an illustration.
A rising death benefit does not automatically mean that the policy uses an increasing death-benefit option. We compare the two options on the same policy in IUL death benefit options.
Do the corridor rules apply to an increasing death benefit too?
Yes, but with an increasing death benefit the corridor rarely changes anything. The corridor is part of the tax-law test for every policy that qualifies under the guideline premium test, whichever death-benefit option it has. An increasing death benefit already includes the cash value, though, so it is usually well above the corridor minimum.
An increasing death benefit is the specified amount plus the cash value. The corridor takes over only when the cash value times the corridor percentage comes to more than that total, which means the part of the percentage above 100% has to cover the whole specified amount on its own. At a 130% corridor, the percentage at age 60, the extra 30% of the cash value would have to exceed the specified amount: a cash value of more than 3 times the specified amount.
On the real policy in this article, with its $500,000 specified amount, we modeled the same premiums with an increasing death benefit. The corridor never set that death benefit through age 100; the specified amount plus the cash value was the larger figure in every year. With the level death benefit, as shown in the chart of the real illustration, the corridor took over at 50.
Does the corridor increase my life insurance costs?
Potentially.
If the corridor causes the death benefit to rise above the specified amount, the policy may temporarily or permanently carry more insurance than the original level amount.
That can increase the net amount at risk, depending on the policy's calculation.
For example:
Cash value: $300,000
Specified amount: $500,000
Corridor-adjusted death benefit: $600,000
The policy is now providing more death benefit than the original $500,000 specified amount.
That additional insurance can affect the policy's insurance costs.
On the real illustration above, most of what the policy ever pays for insurance is paid for insurance the corridor requires. From its 32nd year on, the policy starts every year with more than $500,000 of cash value, so all of the insurance it carries is there because of the corridor. Those years account for 92% of all the cost of insurance the illustration charges through the year he turns 100. What that buys is the larger death benefit in the chart.
The precise calculation depends on the policy contract and insurer.
Why does the corridor matter when evaluating an IUL for cash accumulation?
The corridor illustrates an important point about IULs:
Cash value and death benefit cannot always be analyzed independently.
If cash value grows substantially, it can eventually affect the amount of insurance the policy must provide.
That can in turn affect insurance-related costs.
This is especially relevant when an IUL is being designed or evaluated primarily for cash accumulation. The goal may be to accumulate cash value efficiently, but the policy still has to remain a life insurance contract.
The corridor is part of the mechanism that connects those two things.
How can I tell if the corridor is affecting my IUL illustration?
The corridor is setting the death benefit in any year where a level death benefit rises above the specified amount and equals the cash value times that age's corridor percentage. To spot one, look for a year in which:
- the death benefit begins increasing despite a level death-benefit option;
- cash value is becoming large relative to the specified amount;
- the death benefit is approximately tracking the minimum required relationship to cash value.
Your illustration may also provide policy-specific information about the death-benefit calculation.
If the death benefit changes unexpectedly, compare the relevant year's:
- cash value,
- specified amount,
- death benefit,
- attained age,
- and death-benefit option.
That usually makes the reason much easier to understand.
IULCheck.com reads these columns from your illustration and charts the death benefit year by year, so the year the corridor starts setting it is easy to spot.
Does a larger corridor-driven death benefit mean I am getting more value?
Not necessarily.
A higher death benefit is not automatically a sign of better policy economics.
If the increase is caused by the corridor, it means the policy needs to provide additional insurance to satisfy the applicable requirement.
That additional insurance can come with additional costs.
So when evaluating the policy, look at the relationship between death benefit, cash value, and cost, rather than treating a larger death-benefit number as inherently better.
The bottom line
Think of the corridor as a minimum insurance-to-cash-value relationship.
A level IUL might try to keep its death benefit at $500,000.
But if its cash value grows so large that $500,000 is no longer enough under the applicable corridor, the death benefit has to increase.
As the insured gets older, the required corridor percentage declines.
So there are two competing forces:
Growing cash value → pushes the required death benefit higher
Increasing age → lowers the required percentage
The resulting death benefit is determined by how those two forces interact with the policy's contractual provisions.
That is why a level IUL can show a death benefit that is flat for many years and then rises later in the illustration.
See when the corridor reaches your own policy
Drop your illustration in and we'll chart its death benefit year by year across every market we test, so you can see where it starts to rise above your specified amount.
For the easiest experience, complete your analysis on a computer.
Drop your illustration here
or click to choose a PDF, up to 25MB