Is the Tax-Free Advantage of Indexed Universal Life (IUL) as Good as It's Claimed to Be? A 2026 Case Study Against Investing in the S&P 500 Yourself
Updated:

Indexed universal life (IUL) insurance has long been sold on what it does for you in retirement: tax-free access to your cash value, by borrowing against it. The carriers say so themselves. Transamerica offers "tax-free access to the policy's available cash values" [1], Pacific Life "tax-free distributions to help supplement retirement income" [2], and Allianz says its policy loans and withdrawals "are income tax-free and can be used for any purpose you want" [3]. A Kiplinger column calls it a possible tax-free income buffer in retirement [4], and it is often compared with a Roth IRA: the same tax-free money later, but without the Roth's annual contribution limit [5].
But is it really as good as it's claimed to be? The fees you pay into the policy in its early years could otherwise have compounded into a large sum. Do they offset some of the tax advantage?
For a fair comparison, we simulated investing the same money in the S&P 500 yourself and compared it with borrowing from the IUL, using the last 50 years of market history. We took one real illustration and ran the policy through the S&P 500 from 1976 to 2025, as the index actually moved. Then we put the same premiums, in the same years, into an S&P 500 index fund, and paid every tax the fund would owe: tax on its dividends every year, and on its gain when sold.
Sources. [1] Transamerica, "Transamerica Unveils Financial Choice IUL", press release, January 5, 2023: a properly funded policy "offers customers tax-free access to the policy's available cash values." [2] Pacific Life, "Pacific Life Launches New Flagship Indexed Universal Life Insurance Product", press release, April 8, 2024: "tax-free distributions to help supplement retirement income." [3] Allianz Life, "Life Insurance Options to Protect Your Financial Future", retrieved October 2, 2026: policy loans and withdrawals "are income tax-free and can be used for any purpose you want." [4] Mike Decker, "Retirement Planning with Life Insurance," Kiplinger, June 1, 2023: "an IUL might act as a tax-free income buffer." [5] MoneyGeek, "IUL vs. Roth IRA: Differences, Pros & Cons", updated September 22, 2026: both grow with tax advantages; a Roth IRA has an annual contribution limit, and an IUL has no IRS contribution limit, though overfunding it relative to its death benefit makes it a modified endowment contract and removes the tax-free loans.
The policy and the alternative
The policy is the same real illustration we used in how much an IUL costs and what an IUL would have earned over the last 30 years: a 30-year-old man who does not smoke, with a $500,000 level death benefit and about $101,000 of premiums paid over the first 4 years, then nothing. It offers two index accounts on the S&P 500, and we use the uncapped one, which would have been credited more over these 50 years. It has no cap, but subtracts a 5.5% spread from each year's rise, and credits nothing in a year the index falls.
The alternative is the same premiums, paid in the same 4 years, into an S&P 500 index fund that is never sold until year 50.
What you could spend from each at year 50, when he is 80:
- From the policy, the largest loan he could take out tax-free while keeping the policy in force for the rest of his life, found the way we explain in how much you can actually borrow from an IUL. That is the tax-free advantage, used as fully as the policy allows.
- From the fund, what you would have after selling it and paying the tax on the gain.
The taxes are those of a single person earning about $100,000 a year in a state with no income tax, such as Texas or Florida. The fund is bought, held for 50 years and then sold all at once, so we tax every dollar of its dividends and its gain at the highest federal rate on long-term capital gains, 20%, plus the 3.8% net investment income tax: 23.8% in all. That overstates the fund's taxes, since not every dollar would be taxed at the top rate. The policy's loan pays no income tax.
How much would you have after 50 years with each approach?
You would have about $9.3 million from the index fund after tax, against about $5.0 million from the policy, a little over half as much.
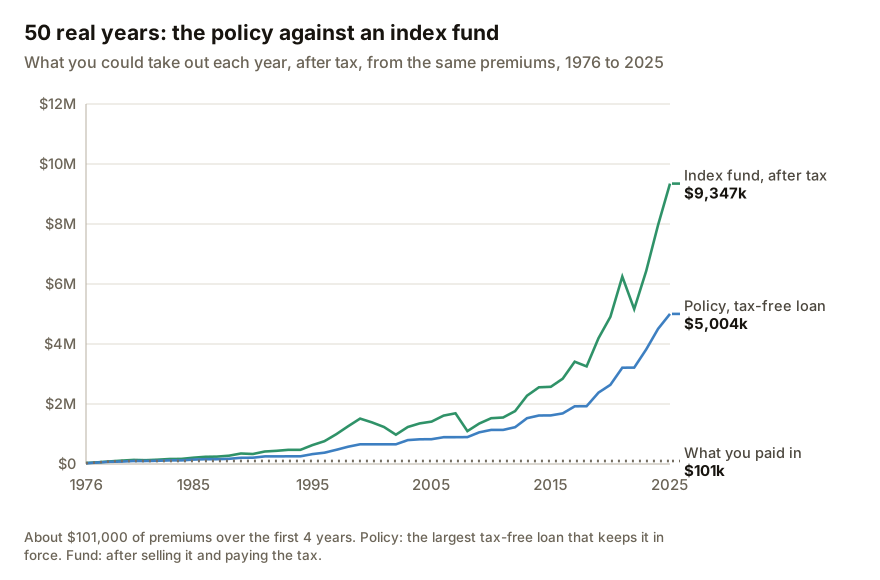
As shown above, the two stay close for the first 15 years or so, and then the fund pulls away. At year 50:
| What you could take out, after tax | After-tax growth rate (IRR) | |
|---|---|---|
| S&P 500 index fund, sold and taxed at 23.8% | about $9.3 million | about 9.7% a year |
| Policy, largest tax-free loan | about $5.0 million | about 8.3% a year |
The growth rate is the IRR: the yearly rate that turns the premiums into what you end up with from each. We explain it in how fast your IUL money is really growing.
Is an IUL's tax-free advantage worth it?
For this policy, over this 50-year market history and under this tax scenario, the policy's tax advantage does not make up the difference. That is a specific case: a 30-year-old man who does not smoke, a policy funded heavily so its charges stay small next to its cash value, a state with no income tax, and 50 years for the money to compound. Your results may differ.
The index fund ends with about $9.3 million after the modeled taxes, compared with about $5.0 million available through the policy's modeled tax-free loan.
That does not mean the tax advantage has no value. It means that, in this particular case, the value of avoiding investment taxes by putting your money into an IUL is not really worthwhile.
And the result is sensitive to the assumptions. If you pay substantial state income taxes, earn substantially more, invest for a different number of years, encounter a different sequence of market returns, or use a different policy design, the relative value of the tax advantage can change.
That's why this comparison is more useful as a starting point than as a verdict on every IUL.
How we compared them, and what we assumed
Both sides use the S&P 500's actual price change in each year from 1976 to 2025. The policy's charges, cost of insurance, and bonuses come from the illustration and are applied using the same model that reproduces its printed cash values. The 5.5% spread is held constant throughout the simulation.
The policy loan is the largest single loan our model finds at year 50 that can be carried while keeping the policy in force under the assumptions used in the simulation.
The fund reinvests its after-tax dividends and pays no fund fee in the base case.
This is deliberately a specific comparison. Here are the important ways it could change.
One stretch of history, one policy
This is one 50-year period and one real policy.
The period from 1976 through 2025 contains several major market declines but also produced substantial long-term equity growth. A different 50-year period could produce a different result.
The policy itself also matters. This illustration is funded heavily and purchased young, so the insurance costs are spread across a relatively large accumulation base. A policy with different funding, a different death benefit, different charges, or a different crediting strategy could produce a different result.
A state with no income tax
The base case assumes no state individual income tax.
That makes the tax comparison simpler and generally reduces the amount of tax the taxable investment pays. In a state with a high income-tax rate, the fund could face an additional layer of taxation that the policy's properly structured loan does not.
That could narrow the gap between the two strategies.
It does not guarantee that an IUL would come out ahead. It means the tax advantage becomes more valuable and needs to be evaluated using the taxpayer's actual tax situation.
50 years to grow
The fund remains invested for the entire 50-year period.
That gives it a long time to recover from the major declines contained in this historical stretch. With a shorter horizon, the sequence of returns can matter much more.
The policy's floor also changes the comparison. A 0% floor means that a negative index year does not directly produce a negative indexed credit, although the policy's other charges still continue.
A shorter horizon can therefore produce a different result, particularly if a major market decline occurs close to the point when the money is needed. However, buying a policy at an older age subjects you to higher insurance costs due to your potentially worse health rating, which means less money in your IUL to grow, too. The result depends heavily on the details.
Our analyzer lets you change the horizon, and simulate different market crash timing, so you can compare the policy to investing yourself over a variety of scenarios.
Dividends are simplified
We assume a flat 1.5% annual dividend yield.
The S&P 500's historical dividend yield was considerably higher in some earlier periods—for example, 3.87% at the end of 1976, 4.61% in 1980, and 3.68% in 1990—before falling toward the roughly 1%–2% range seen in more recent years, per multpl.com's table, which draws on S&P and Robert Shiller's data. Historical dividend data therefore would not have been flat over this period.
Using actual historical dividends would change the fund's result, particularly in the earlier decades, so this assumption is worth keeping in mind.
The spread is held at today's 5.5%
The policy's spread is held at 5.5% for the entire simulation.
If the carrier changed the spread in the future, the policy's credited values could differ. The contract's stated maximum is substantially higher, so holding the spread at 5.5% throughout the simulation is an assumption rather than a guarantee.
The fund pays no fee
The base case assumes no fund expense ratio.
A low-cost S&P 500 fund would normally have a small expense ratio. For example, Vanguard's 500 Index Fund Admiral Shares lists a 0.04% expense ratio in its 2026 prospectus. Adding a fee of that size would reduce the fund's ending balance somewhat, but it would not account for most of the difference in this example.
The final sale is simplified
We tax every dollar of the fund's dividends and gain at 23.8%, the top federal rate on long-term capital gains plus the net investment income tax.
That overstates the fund's taxes. Federal capital-gains rates depend on taxable income: while he is earning about $100,000, his dividends would be taxed at 15%, and even a sale in a single year would have part of its gain taxed at the lower rates.
Selling gradually over retirement could also spread the gains over multiple tax years and keep more of them at the lower rates.
So the final tax bill depends heavily on how and when the investor actually uses the money.
One lump-sum loan at 80
The policy side is modeled as one large loan at age 80.
Most people would not actually take all their available policy cash in one transaction. They might borrow gradually over many years.
The same is true of the fund: an investor could sell shares gradually rather than liquidating the entire account at once.
Modeling an income stream instead of a single year-50 withdrawal can therefore change the tax comparison.
Money for you, not protection
The comparison asks what each strategy makes available for the policyholder to spend.
The IUL also provides a death benefit. The index fund does not.
If the actual goal is to provide a specified amount of life insurance protection, the fair comparison is different: you can compare the IUL with buying term insurance and investing the remaining money. That comparison accounts for the cost of obtaining the same protection outside the IUL.
Tax laws can change
Nobody can know what federal or state tax rates will look like over a 50-year period.
Our model therefore uses today's tax assumptions as a consistent way to compare the two strategies rather than pretending to predict future tax law.
And, of course, the fund investor also has to actually stay invested. Historical returns do not guarantee future results, and selling after a market decline can materially change the outcome.
One policy's answer is not everyone's answer
In this example, the IUL's tax-free access to cash is valuable—but not valuable enough to overcome the other differences between the policy and simply investing the same premiums in the S&P 500.
That is the result for this policy, this funding pattern, this 50-year market history, and this tax scenario.
Change the assumptions and the answer can change.
Your own policy may have different charges, caps, spreads, bonuses, or insurance costs. You may face different federal and state tax rates. You may have 20 years rather than 50. You may care more about guaranteed death-benefit protection than accumulated cash. And the market may behave very differently from the period we just tested.
Our analyzer works through those differences using your own illustration. It can compare your policy over the horizon you choose, at your tax assumptions, through real historical market periods and a range of other scenarios—including crashes at different points, a lost decade and flat markets.
And if you add a term-insurance quote, it can also compare the IUL with buying term insurance and investing the difference, so the cost of the insurance protection is accounted for on both sides. Our article on buying term and investing the rest vs. an IUL makes that comparison on this same policy, with a $500,000 term policy on the fund's side.
See how your own policy compares with investing
Drop your illustration in and we'll run your policy and an index fund through real market history and a range of other markets, and show what you would end up with from each, after every fee and every tax — at your own policy's caps, spreads and charges.
For the easiest experience, complete your analysis on a computer.
Drop your illustration here
or click to choose a PDF, up to 25MB