How Fast Is Your Indexed Universal Life (IUL) Money Really Growing?
Updated:

Every indexed universal life (IUL) illustration prints a rate on its front page. On the one we'll use here, it's 6.59%. It's easy to read that as "my money grows 6.59% a year." It doesn't — and the number that tells you how fast it actually grows is already hiding in the illustration's own columns.
What does the illustrated rate actually mean?
The illustrated rate is a crediting rate: the interest the carrier adds to your account each year. It's what goes in before anything comes out.
What comes out is the policy's charges — the premium charge, the policy fee, the cost of insurance and the rest. They're taken from the same account, every year. (We break down exactly what they are, and when they land, in how much an IUL costs.) So the account grows at the crediting rate minus what the charges take — plus any loyalty bonus the carrier credits in later years.
To see what you actually earn after all of that, you need a different number.
What is an IRR?
An IRR — internal rate of return — answers one question: if my money had earned the same rate every year, what rate would have grown it to what I actually ended up with?
It needs just two things:
- What you paid, and when. Every premium, in the year you paid it. A dollar paid in year 1 has had longer to grow than a dollar paid in year 10, so the timing matters.
- What you ended up with. The cash value at the end.
Out comes one steady yearly rate that connects the two. It's the same calculation a bank uses to quote a savings rate, and nothing about it is special to insurance.
How far apart are the illustrated rate and the IRR?
On one real illustration, the rate on the front page is 6.59%, but the IRR at year 40 is about 5.9%.
Here's a real IUL illustration, for a 30-year-old man who does not smoke. He pays about $101,000 in premiums over the first 4 years, and nothing after that. At year 40, the illustration shows a cash value of about $923,000.
Put those into an IRR and you get about 5.9% a year — against the 6.59% on the front page. That's a gap of about 0.7 percentage points a year.
It sounds small. It isn't. If the same premiums really had grown at 6.59% a year with nothing taken out, the account at year 40 would be almost 30% larger. That difference is mostly what the charges take out, net of the bonus.
Why does the IRR rise the longer you hold an IUL?
The IRR isn't one fixed number. It depends on how long you hold the policy, because its heaviest charges, relative to the size of the account, land in its first decade.
On this illustration, measured after 10 years the IRR is only about 3.5%. By 40 years it's about 5.9%. Held all the way to age 100, it reaches about 6.2% — closer, but still under 6.59%.
The early charges don't go away. They're simply spread across more and more years of compounding, so their effect on the yearly rate shrinks. That's why the same policy's growth rate looks very different to someone who surrenders early and someone who holds for life — and why a growth rate only means something once you say over how many years.
How do you calculate an IUL's IRR?
Take the IRR of the premiums you paid, entered as negative numbers, followed by the cash value in the year you want to measure, entered as a positive one. You can do this simple exercise in Microsoft Excel or Google Sheets yourself — every number it takes is printed in your illustration:
- In one column, list the premium you pay each year as a negative number — it's money going out — from year 1 through the year you want to measure. Years with no premium get a 0.
- In the next column, beside that last year, enter the cash value the illustration shows at the end of that year, as a positive number.
- Put the two together with
VSTACK, which stacks the cash value under the premiums, and take the IRR of the result:=IRR(VSTACK(premiums, cash value)).
For this illustration, measured at year 40, that's 40 premium cells — only the first 4 of them not zero — and the year-40 cash value beside the last one. The result is the 5.9% above.
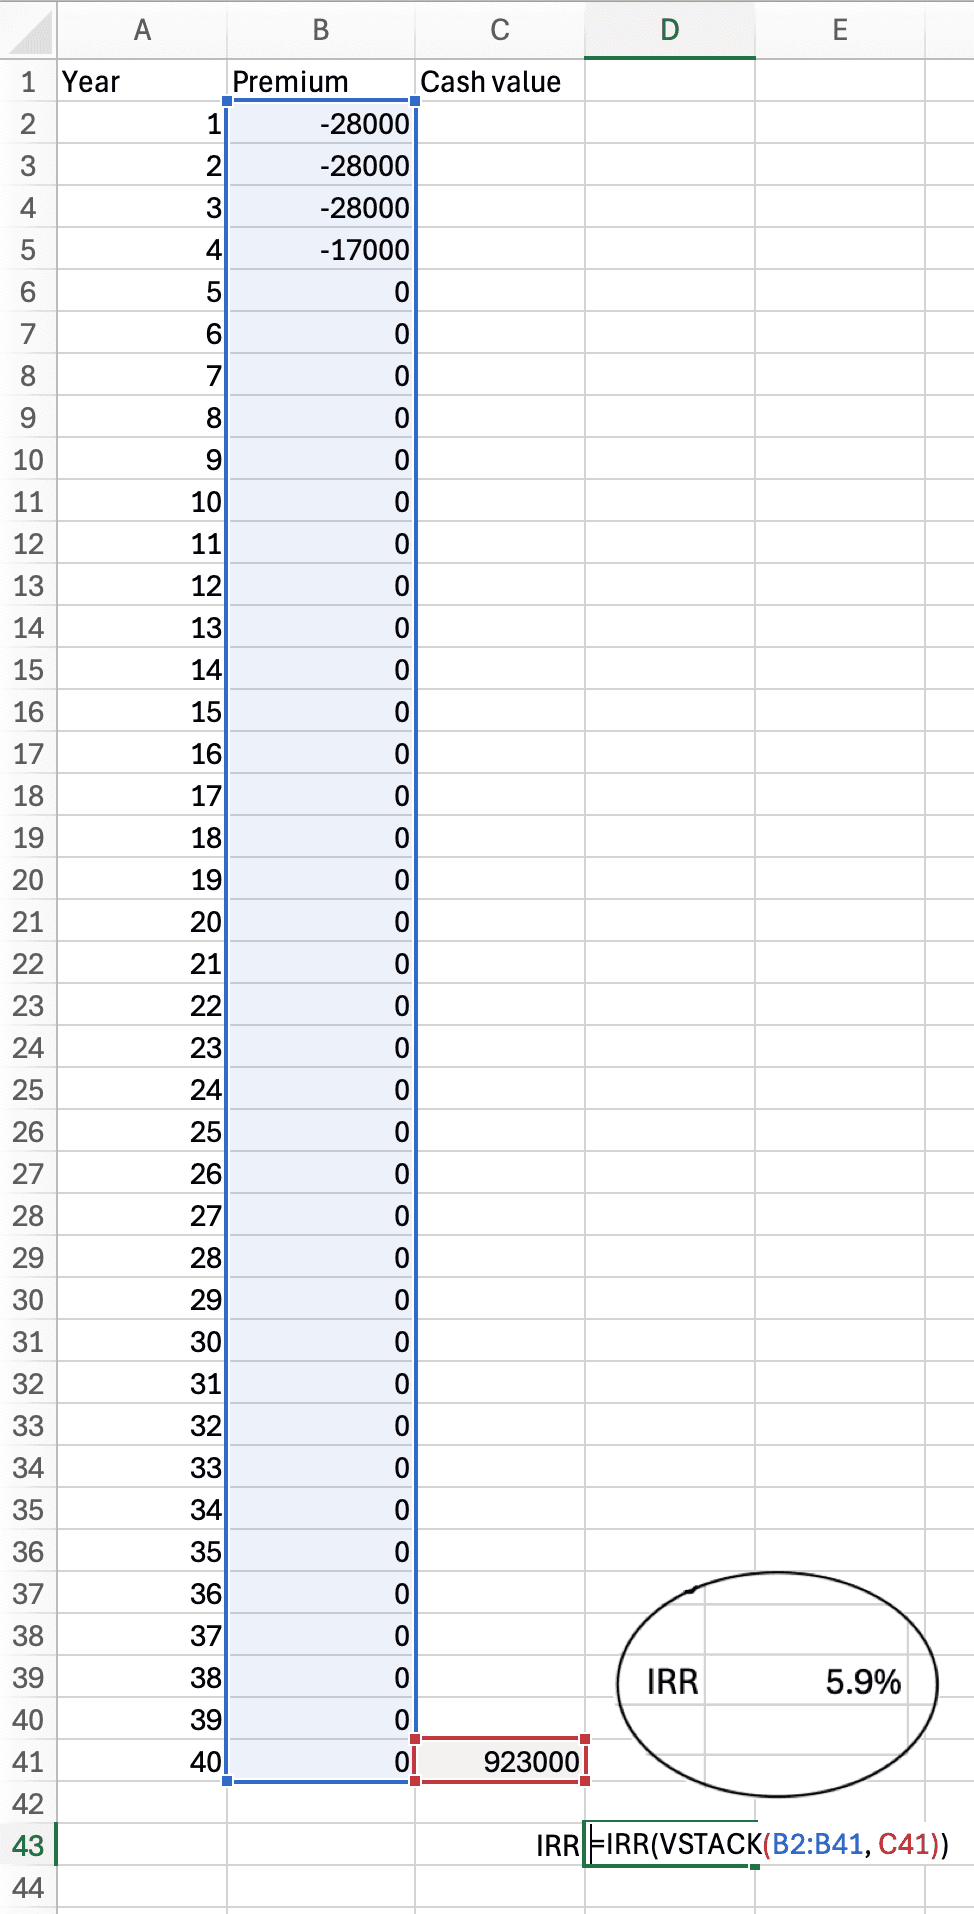
Measure at a later year — extend the premium column and use that year's cash value — and you'll see the IRR climb, just as it does above.
Or skip the spreadsheet: IULCheck.com reads the premiums and cash values from your illustration and works out the IRR for the holding periods you choose.
Find the real IRR on your own policy
Your illustration has its own premiums, its own charges and its own illustrated rate, so its IRR will be different. And the illustrated rate assumes you're credited the same rate every single year, which is not how markets move.
Find your policy's real growth rate
Drop your illustration in and we'll work out its IRR at every decade — then run the policy through 24 different markets to see how fast it could grow when the market doesn't hand you the illustrated rate every year.
For the easiest experience, complete your analysis on a computer.
Drop your illustration here
or click to choose a PDF, up to 25MB