Buy Term and Invest the Rest vs. Indexed Universal Life (IUL): The Death Benefit and the Cash Value, on One Real Policy
Updated:

Table of contents
- What is buy term and invest the rest?
- Which pays your beneficiary more, an IUL or buying term and investing the rest?
- Which has the larger expected death benefit?
- Which would give you more cash to use yourself?
- What happens when the term ends?
- What we assumed in this comparison
- Your own policy, with your own term quote
An indexed universal life (IUL) policy does two jobs: it pays a death benefit, and it builds cash value you can borrow against. The usual alternative splits those jobs between two products. You buy term life insurance for the death benefit, and invest the rest of what the IUL would have cost. Splitting the jobs this way is "buy term and invest the rest", or BTIR.
In our article comparing one real IUL with an S&P 500 index fund, the fund had no life insurance at all, so the comparison was only about the cash. In this article, the fund side buys its own term coverage. We compare both halves: what your beneficiary would receive if you died, and how much cash you would have to use yourself.
What is buy term and invest the rest?
Buy term and invest the rest means buying a term life policy for the coverage you need and investing the difference between its premium and what a permanent policy would cost. The term policy pays only if you die while it is in force, so its premium is much smaller. The investment account belongs to you, and it passes to your beneficiary when you die.
The IUL is the same real illustration we have used before: a 30-year-old man who does not smoke, a $500,000 level death benefit, and about $101,000 of premiums paid over the first 4 years, then nothing. We use its uncapped account, which has no cap, subtracts a 5.5% spread from each year's rise, and credits 0% in a year the index falls.
The BTIR plan pays the same premiums in the same years, split two ways:
- A $500,000 term policy for 30 years, at $500 a year, so the coverage matches the IUL's until he is 60. $500 is a little above typical prices: Policygenius's average for a 30-year-old man who does not smoke, in its best health class, is $33.55 a month, about $403 a year [1].
- The rest of each premium in an S&P 500 index fund. After the 4th year, when the premiums stop, the term premium is paid by selling shares, along with the tax on what is sold.
The market is the S&P 500's actual price change in each year from 1956 to 2025, plus dividends for the fund. We use 70 years, not 50, so the comparison runs to age 100: the death benefit question covers a whole life. Over those 70 years, the index's price grew about 7.4% a year.
The taxes are those of someone earning about $100,000 in a state with no income tax, with every dollar of the fund's dividends and gains taxed at 23.8%, the top federal rate on long-term gains plus the net investment income tax. Taxing every dollar at the top rate overstates the fund's taxes. Two things are untaxed on both sides: a life insurance death benefit is generally not taxable income for the beneficiary [2], and a beneficiary who inherits the fund takes it at its value on the date of death, so its gains are never taxed [3].
Sources. [1] Policygenius, "30-year term life insurance: What is it & how much does it cost?", updated July 20, 2026: $33.55 a month for a 30-year-old man, nonsmoker, Preferred Plus, $500,000 for 30 years. [2] IRS, "Life Insurance & Disability Insurance Proceeds", reviewed September 23, 2026: life insurance proceeds received as a beneficiary "aren't includable in gross income." [3] IRS, "Gifts & Inheritances", reviewed September 29, 2026: the basis of inherited property is its fair market value on the date of death.
Which pays your beneficiary more, an IUL or buying term and investing the rest?
On these 70 years, buying term and investing the rest paid more in 65 of them. The IUL paid more only at ages 61 to 63, just after the term ended, and at 83 and 84, after the 38.5% fall in 2008.
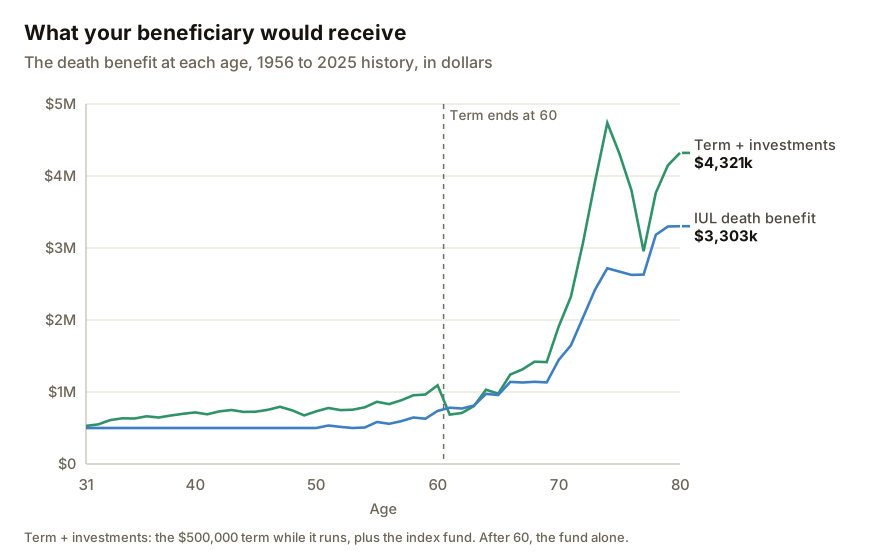
As shown above, the 2 plans pay in different ways:
- Until 60, the BTIR plan pays the term's $500,000 plus the whole fund. The IUL pays its $500,000, so the BTIR plan is ahead by the size of the fund.
- At 60, the term ends and the BTIR plan's death benefit falls to the fund alone, about $686,000 at 61 against the IUL's $782,000.
- From 61 on, the fund grows faster than the IUL's death benefit, and the BTIR plan moves back ahead at 64, apart from ages 83 and 84.
The IUL's death benefit does not stay at $500,000 either. As the policy's cash value grows, tax rules require the death benefit to stay a set percentage above the cash value, which we explain in our article on the cash value corridor. From his early 50s, that requirement is what raises the IUL's death benefit.
| Age | IUL death benefit | Term + index fund |
|---|---|---|
| 40 | $500,000 | about $717,000 |
| 60 | about $738,000 | about $1.09 million |
| 61 | about $782,000 | about $686,000 |
| 80 | about $3.3 million | about $4.3 million |
| 100 | about $18.9 million | about $29.3 million |
Which has the larger expected death benefit?
Buying term and investing the rest: the IUL's expected death benefit is about $0.75 for every $1 of the BTIR plan's, about $5.8 million against $7.7 million.
The expected death benefit weights what each plan would pay at every age by the chance of dying at that age. The weighting answers the question the year-by-year chart cannot: the BTIR plan is ahead before 60 and close after, so which matters more? The chances come from the 2017 CSO mortality table, the standard US table published by the Society of Actuaries [4]. By the 2017 CSO table, a 30-year-old man who does not smoke has about a 96% chance of being alive at 60, when the term ends, and about a 73% chance at 80. So most of the weight falls on the years after the term, when the BTIR plan's death benefit is the fund alone.
The result barely depends on his health. Across the table's 3 preferred health classes, the IUL's expected death benefit stays between $0.75 and $0.76 for every $1 of the BTIR plan's.
Sources. [4] Society of Actuaries, "2017 CSO Tables": the 2017 Commissioners Standard Ordinary tables, by sex, smoker status and age, completed by the SOA's Valuation Table Team. We use the unloaded version, which is the best estimate of actual mortality rather than one set high for reserves.
Which would give you more cash to use yourself?
Mostly the index fund. Sold, with the tax paid, the fund was worth more than the IUL's largest tax-free loan at most ages, but the IUL was ahead from 49 to 61 and again from 83 to 87.
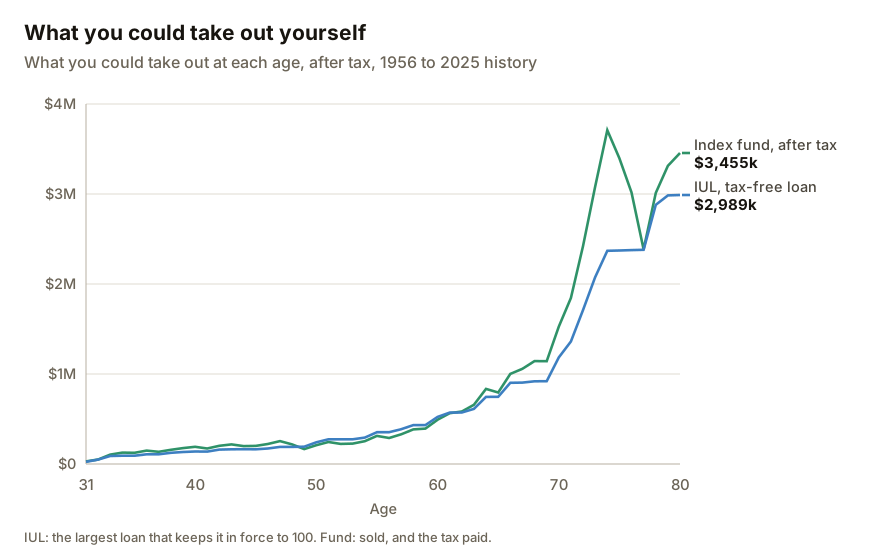
As shown above, the 2 lines stay close until about 70, and then the fund pulls ahead. The IUL's lead from 49 to 61 came after the 16 years from 1966 to 1981, when the index's price grew only about 1.8% a year. Over those years the fund was also paying the term premium, by selling shares.
| Age | IUL, largest tax-free loan | Index fund, after tax |
|---|---|---|
| 45 | about $164,000 | about $201,000 |
| 60 | about $523,000 | about $492,000 |
| 80 | about $3.0 million | about $3.5 million |
| 100 | about $17.9 million | about $23.0 million |
The IUL's cash value and its death benefit come from the same account: borrowing from the policy lowers the death benefit by the loan. After 60, the BTIR plan's cash and its death benefit also come from one account, since its death benefit is then the fund alone. Before 60, the BTIR plan can spend from the fund and still keep the term's $500,000 in force.
What happens when the term ends?
The coverage stops, and the fund is all your beneficiary would receive. On these 70 years, the fund was large enough by then that the drop was small: the BTIR plan's death benefit went from about $1.09 million at 60 to about $686,000 at 61, a little below the IUL's.
How small the drop is depends on the market before 60. A weak stretch in the fund's first 30 years would mean a smaller fund when the coverage stops, and buying a new term policy at 60 costs far more than at 30, if you can still qualify. The IUL's death benefit does not end at 60, as long as the policy stays in force.
What we assumed in this comparison
One policy, one history
This comparison uses one real policy, funded heavily and bought young, and the 70 years from 1956 to 2025. A different policy or a different stretch of the market could give a different result.
The term premium
We assume $500 a year, a little above the best-class price we found. A cheaper quote would put more into the fund, which helps the BTIR plan; a worse health rating would raise the term premium, which hurts the BTIR plan.
Taxes, dividends and the spread
The fund's taxes are overstated, since every dollar is taxed at the top rate, and there is no state income tax. Dividends are a flat 1.5% a year. The policy's spread is held at today's 5.5% for all 70 years.
Dollars far in the future
All figures are in the dollars of their own year, with no adjustment for inflation. The expected death benefit is heavily weighted toward deaths in his 80s and 90s, when the dollar amounts are largest, and it counts only deaths before 100.
Investing, every year
The BTIR plan works only if the money is actually invested, kept invested through crashes, and the term premium is paid every year for 30 years. The IUL needs no decisions after its 4 premiums are paid; its charges come out on their own.
Your own policy, with your own term quote
On this policy and these 70 years, buying term and investing the rest paid the larger death benefit at most ages and had the larger expected death benefit. The IUL had more cash to use in the middle years, after a weak stretch of the market.
Our analyzer makes this comparison for the policy in your own illustration. Enter a term quote, and it compares your policy with buying that term policy and investing the rest: the death benefit at every age, the expected death benefit across health classes, and what you could take out yourself, through real history and a range of other markets, over the horizon you choose.
Compare your own policy with buying term and investing the rest
Drop your illustration in, add a term quote, and we'll show what each would pay your beneficiary and what you could take out yourself, after every fee and every tax.
For the easiest experience, complete your analysis on a computer.
Drop your illustration here
or click to choose a PDF, up to 25MB