Was It Just Lucky Timing? A Case Study of How Indexed Universal Life (IUL) Handles Sequence-of-Returns Risk
Updated:

IUL has long been sold on its floor. In a year the index falls, the policy is credited 0%, and its cash value does not fall with the market. National Life, for one, says that when the index goes down, "your policy's cash value is protected from losses due to that decline" [1].
The floor is pitched against sequence-of-returns risk: the risk that the market falls just as you retire and start withdrawing, so you sell investments at low prices, and the money you took out never gets the chance to recover. Schwab warns that a market drop in the early years of retirement can leave your portfolio short of lasting as long as you need [2]. The crash most people think of is 2008, though a study by the planner Michael Kitces found that the real danger is a mediocre decade, not one sharp fall followed by a sharp recovery like 2008's [3].
The protection is real. In our article comparing one real IUL with an S&P 500 index fund, we ran one real policy through the S&P 500 from 1976 to 2025, when the index's price grew a staggering 9% a year, and an index fund ended with close to twice as much to spend as the policy's tax-free loan, after every fee and every tax. But 1976 to 2025 was one stretch of history, in the order the years actually came, and retiring at a low point has consequences. Suppose the same 50 years had come in a different order, with the crashes landing at the worst moment. Would the floor have paid off?
To find out, we kept the same 50 yearly returns of the S&P 500 and changed only their order.
Sources. [1] National Life Group, "Indexed Universal Life Insurance: Upside Potential and Downside Protection", retrieved October 3, 2026: with a zero percent floor, "your policy's cash value is protected from losses due to that decline." [2] Rob Williams, "What Is Sequence-of-Returns Risk?", Charles Schwab, January 30, 2026: a market drop early in retirement can mean "your portfolio may not last as long as you need." [3] Michael Kitces, "4% Rule Results Since The Tech Bubble & Financial Crisis?", Kitces.com, July 29, 2015: a 2008 retiree withdrawing 4% a year was ahead of the historical worst cases, because the market rebounded quickly; the dangerous sequence is "a mediocre decade's worth of returns, not just a sharp single-year decline."
How do you test sequence-of-returns risk? Same years, different order
We tested 5 orders of the same 50 years:
- The real order, 1976 to 2025.
- Reversed, so the 50 years start with 2025 and end with 1976.
- Shuffled 3 times into random orders.
Every order ends in the same place. A dollar in the S&P 500 grows to about $76 by year 50, not counting dividends, whichever order the years come in, because the same yearly changes multiply to the same total. What changes is the route: when the crashes come, and what comes before them.
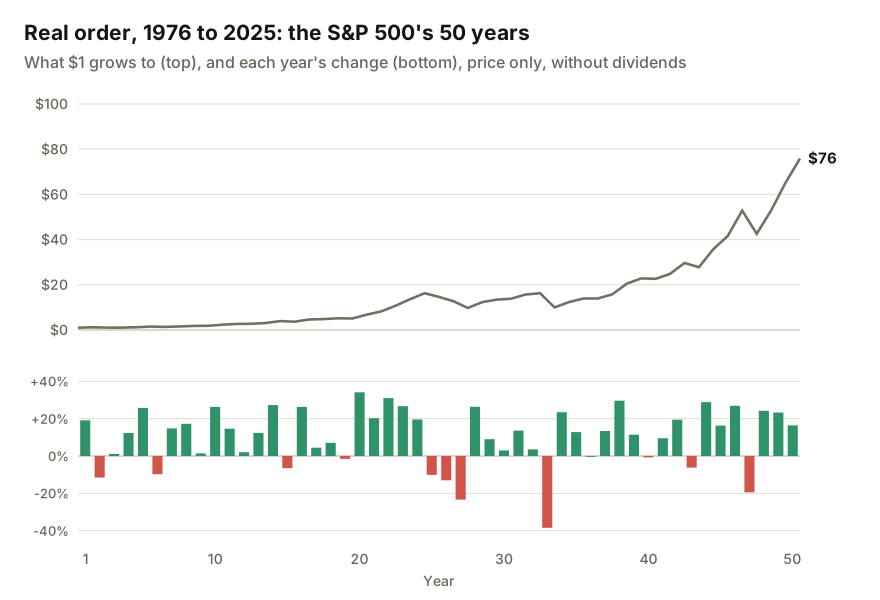
We use the policy, the fund and the taxes from our article comparing one real IUL with an S&P 500 index fund: a real policy bought by a 30-year-old man who does not smoke and paid for over 4 years; an index fund bought with the same premiums in the same years; and every dollar of the fund's dividends and gain taxed at 23.8%.
Does the order of returns change whether an IUL beats investing?
Not at year 50: in all 5 orders, the index fund ended with between 1.8 and 2.0 times as much as the policy.
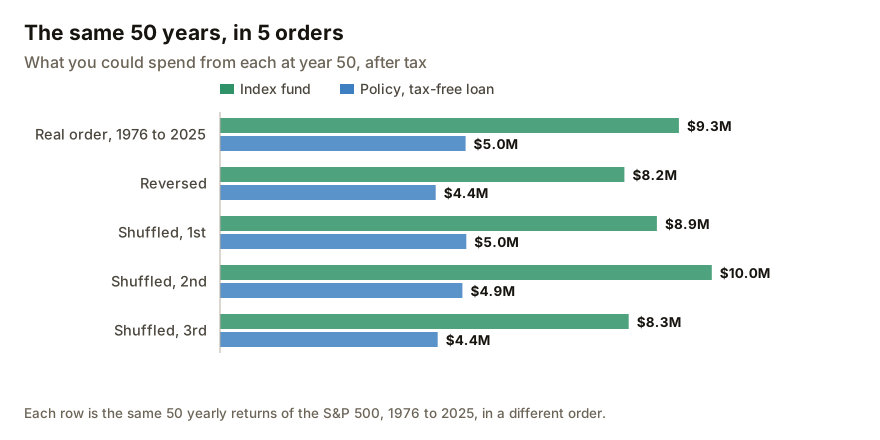
As shown above, the fund's and the policy's amounts both change from one order to another, but the gap between the two barely does. Here is what each could be taken out for in every year of each order:
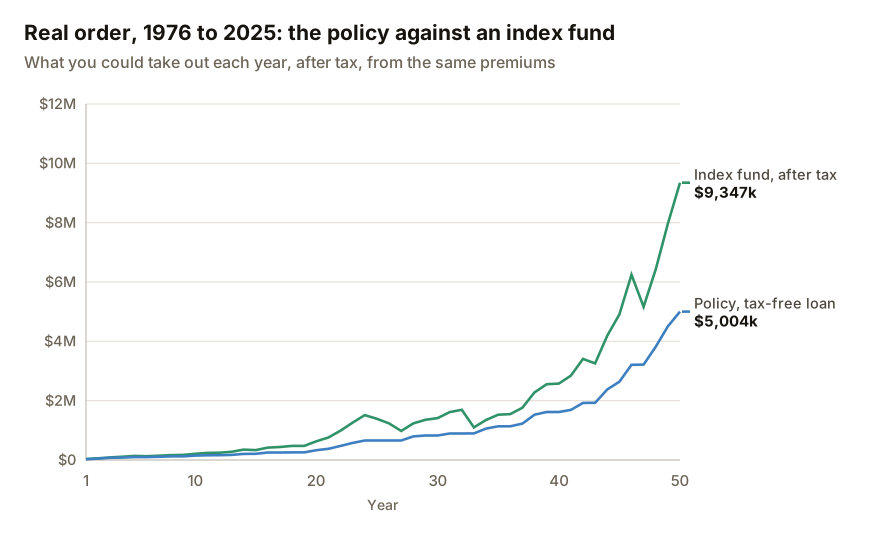
As shown above, the policy's line almost never goes down. In any year of any of the 5 orders, its cash value fell by at most about half a percent, in years the index fell and the charges came out with nothing credited. The fund fell by as much as 35% in a single year.
A cash value that never falls more than half a percent in a year is strong protection, though not complete: the charges still come out in a year the policy is credited nothing. For someone who wants peace of mind, this protection is worth something real. The question, once again, is what it costs, and the answer differs with how many years you plan to keep the policy, your age and health when you buy it, and the policy's own charges. Our analyzer works that out for your own policy.
What if you need the money during a downturn?
Then the policy can come out ahead. In the 1st shuffled order, the index fell 38% in year 5, right after the last premium, and fell in 6 more years by year 17. The policy was ahead in year 5 and in every year from 8 to 27.
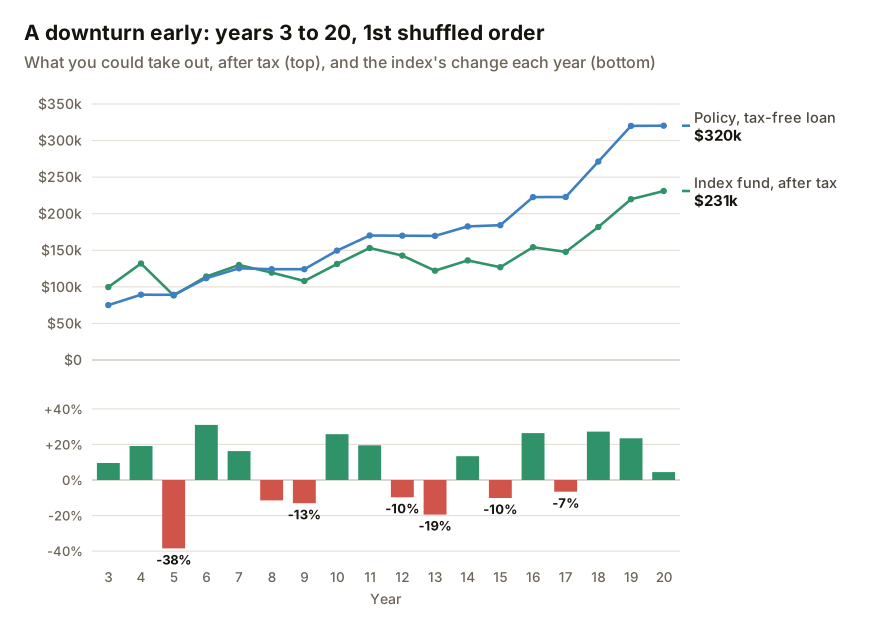
As shown above, in each red year the policy's line stays flat: the 0% floor credits nothing, but the account does not fall with the index. The fund's line drops with the index. With a fall every year or two, the fund kept falling back after each recovery, and the policy kept what it had. If you had needed the money in year 17, you would have had about half as much from the policy as from the fund.
In a downturn later in the policy's life, the policy's line again stays flat while the fund's drops, and by then the fund has more to lose:
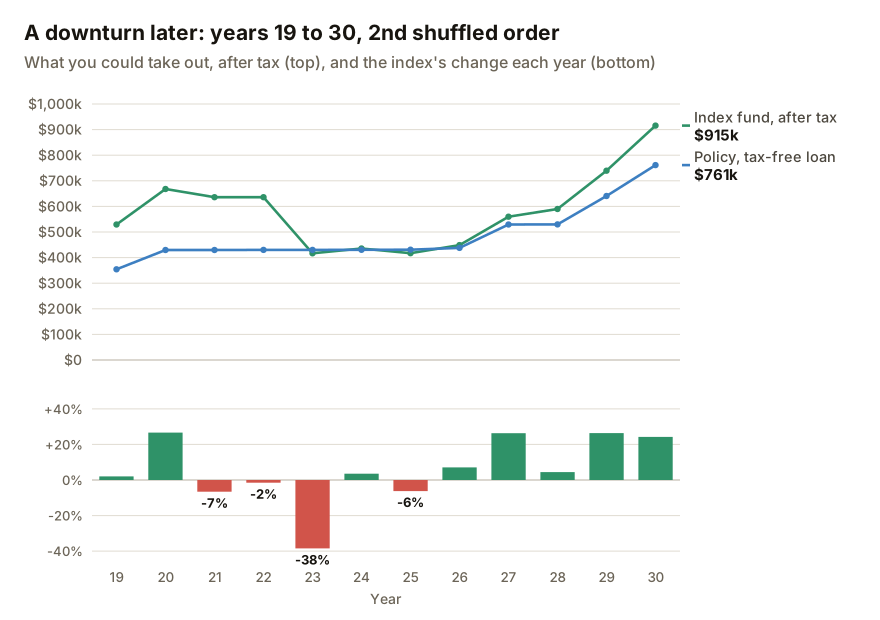
As shown above, the 38% fall in year 23 wiped out the fund's lead, and the policy was ahead in years 23 and 25. Then the market recovered, and the fund pulled ahead again.
So the order of returns does matter, but in the middle of the policy's life rather than at the end. Over the full 50 years, the fund came out ahead in every order.
So was it just lucky timing?
If we look at the full stretch of 50 years - no, S&P didn't just win over IUL because of the particular order or timing of each year's return. Reversing or shuffling the same 50 years doesn't meaningfully change the verdict: the index fund came out ahead at year 50 in every order, with 1.8 to 2.0 times as much as the policy each time.
But when you take the money out matters. In 3 of the 5 orders, a downturn put the policy ahead for a while: for 1 year in the reversed order, 2 years in the 2nd shuffled order, and 24 years in the 1st shuffled order, most of them between years 5 and 27. In those years, you would have had more from the policy if you had needed the money.
These findings hold for one policy, 5 orders and one set of tax assumptions. A different policy, a different horizon or a different market could change the result.
What we assumed in this test
Five orders are not odds
We tested the real order, its reverse, and 3 shuffled orders, each drawn once at random and then fixed. Other shuffles would give other routes. The 5 orders show what can happen, not how likely each outcome is.
The same returns, in every order
Reordering keeps every year's return, so the average growth is the same in all 5. Reordering tests when the good and bad years come, not a market that grows more slowly or faster overall, which is a different question.
The same policy, fund and taxes, with the same limits
The policy, the fund and the taxes are taken from our article comparing one real IUL with an S&P 500 index fund, and so are their limits. The fund's taxes are overstated, since every dollar is taxed at the top rate, and there is no state income tax. Dividends are a flat 1.5% a year. The policy's spread is held at today's 5.5% throughout.
Each year is its own what-if
Each point on the charts assumes you take everything out in that year and nothing before. Most people would draw money out over many years, which changes both sides.
Your own policy, in more than one order
On the 50 years from 1976 to 2025, the order of returns did not change the answer at year 50. But a downturn at the wrong moment could have, if you had needed the money then.
Our analyzer runs your own policy through these same 5 orders, along with constructed markets, including crashes early, midway and late, a lost decade, and flat years. It compares the policy with investing the same premiums yourself over the horizon you choose, at your own tax rates.
See how your own policy holds up when the order changes
Drop your illustration in and we'll run your policy and an index fund through real history, reversed and reshuffled history, and a range of constructed markets, and show what you would end up with from each, after every fee and every tax.
For the easiest experience, complete your analysis on a computer.
Drop your illustration here
or click to choose a PDF, up to 25MB