Understanding Indexed Universal Life (IUL): Architecture, Mechanics, and Trade-Offs
Updated:

Indexed Universal Life (IUL) is a form of permanent life insurance designed to combine lifetime coverage with growth linked to equity market performance. While traditional Whole Life relies on fixed guarantees and bundled pricing, IUL operates as an unbundled, modular contract.
Understanding how IUL works requires looking directly at its structural components: flexible premium structures, crediting parameters, and internal charge mechanics.
If you have not read the earlier two, how life insurance works explains why permanent coverage needs a cash reserve at all, and the evolution of life insurance explains why the IUL product ended up shaped this way today.
1. How is an IUL different from whole life insurance?
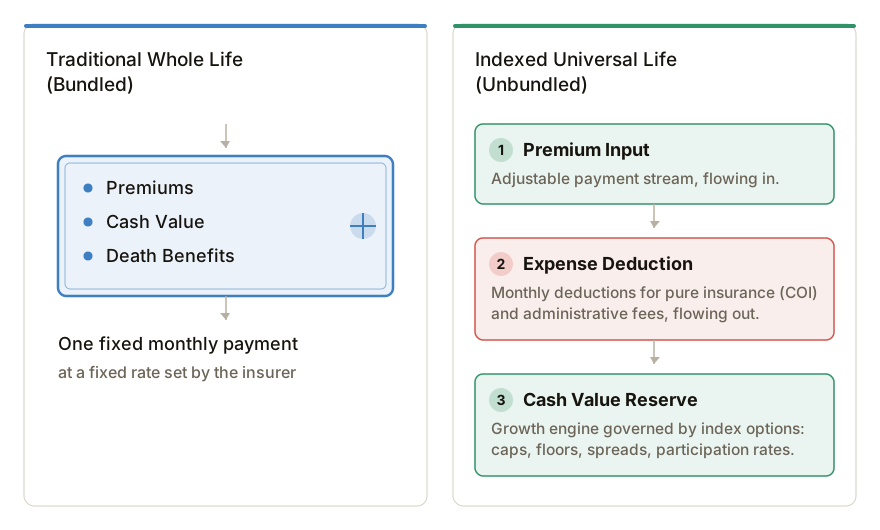
Whole life bundles the premium, the charges and the growth into one fixed package; an IUL separates them, so you can see and adjust each part. That has practical consequences. In a tight year you can pay less, or nothing at all, as long as the cash value can cover that year's charges. And because every charge is printed, you can see exactly what the insurance costs you each year and how much of your premium goes on to grow, and you can spot the cost of insurance climbing years before it starts to drain the policy, while there is still time to pay in more.
The fundamental difference between Whole Life and IUL lies in operational transparency and control:
- Whole Life (Bundled): The policyholder pays a mandatory fixed premium. The insurance company pools these funds internally, manages the underlying investments, pays the mortality costs, and credits the policy with a fixed rate plus potential dividends. The policyholder cannot see or modify internal costs.
- IUL (Unbundled): Premium payments, policy expenses, and cash value growth are separated into explicit line items. The policyholder can view the precise monthly Cost of Insurance (COI), administrative charges, and net cash value allocations.
2. What do the floor, cap rate, participation rate and spread mean in an IUL?
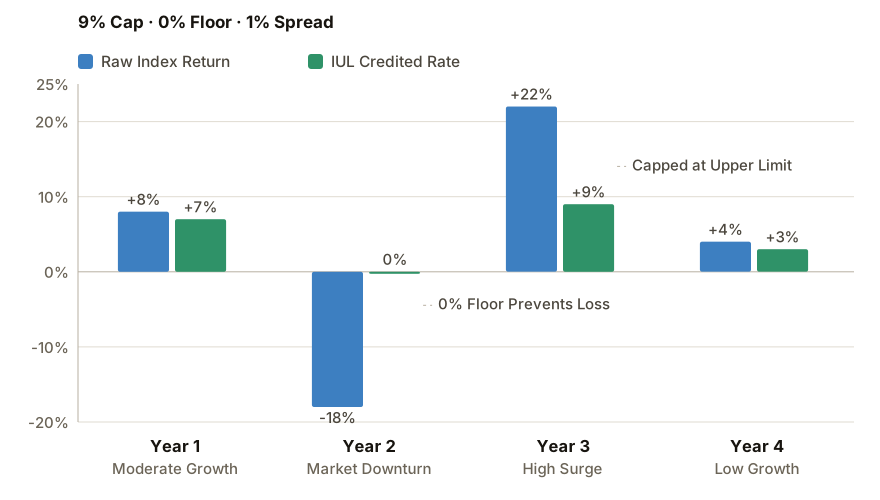
They are the four terms that turn the index's yearly change into the interest credited to your cash value. The floor is the least you can be credited in a year, usually 0%, however far the index falls. The cap rate is the most you can be credited, however far it rises. The participation rate is the share of the index's rise that counts, and the spread is a fixed number of points taken off the rise first.
Unlike Whole Life, which offers a fixed interest rate backed primarily by an insurer's general bond portfolio, IUL ties cash value growth to the performance of an underlying equity index (such as the S&P 500).
The policyholder's money is not directly invested in the stock market. Instead, the insurer places the majority of funds in fixed-income instruments and uses the yield to purchase call options on the index. The returns credited to the cash value are governed by four primary parameters:
The 0% Floor
The defining risk-mitigation feature of an IUL is the guaranteed floor (typically 0% to 1%). If the underlying index experiences a negative annual return (e.g., -20%), the policyholder receives a 0% credit for that segment. The cash value does not lose funds due to direct market declines.
A 0% credit is not a 0% year, though. The floor stops the crediting from going negative. It does not stop the charges, which come out every month whatever the index did. In a long flat stretch those charges exceed what was credited and the cash value falls anyway.
The Cap Rate
In exchange for downside protection, the insurer sets a maximum limit on credited growth during strong market years. If a policy has a 9% cap and the underlying index rises by 18%, the credited interest to the policy is capped at 9%.
Participation Rate
The participation rate determines what percentage of the index's growth is allocated to the policy. If an index gains 10% and the policy has an 80% participation rate (with no cap blocking it), the credited return is 8%.
Spread
Some IUL contracts utilize a Spread (or margin) instead of, or in addition to, caps and participation rates. A spread is a flat percentage subtracted from the index's growth before crediting interest.
- Example: If the index grows by 12% and the policy has a 3% spread with a 100% participation rate, the net interest credited to the cash value is 9% (12% minus 3%).
An illustration typically presents different indexing strategies, each using different parameters to cap the market index's return, and even being anchored to different indexes. For example, one strategy might be on S&P 500, with a 10.5% cap, 100% participation and 0% spread, and another on S&P 500 with no cap, still 100% participation, but a 5.5% spread—the exact performance of the former, capped one vs. the latter, uncapped depends heavily on the market, and one must simulate different market scenarios in order to reach a conclusion.
What these are actually set at
Those are the mechanics. Here is what the numbers look like in practice, taken from real illustrations we have read:
| Lever | 'Current' rates shown on illustration | 'Guaranteed' rates shown on illustration |
|---|---|---|
| Cap | 9.25%, 10.0%, 10.5%, 11.5% | 2.0%, 2.75%, 4.0% — and one printed none at all |
| Floor | 0% on all but one, which had 0.25% | The same |
| Participation rate | 100%, except one uncapped account at 45% | 100%, and 5% on that uncapped account |
| Spread | 5.5% on one uncapped account | 20% on the same account |
Read the last two columns together. The "current" rates are used to calculate the most optimistic cash value growth trajectory on your illustration. The "guaranteed" rates are what the carrier may move to without asking you (and somewhat counterintuitively, "guaranteed" rates are worse than "current", non-guaranteed ones). A cap of 10.5% today will give you far more returns than the 4% guaranteed one, and a spread of 5.5% today, likewise, is much better than the guaranteed 20%.
Why are there so many components in an IUL?
Because each one does a separate job. The adjustable premium lets you change what you pay; the separate charges show what the insurance and the administration cost; and the crediting terms (floor, cap rate, participation rate and spread) let the cash value share in the index's gains while protecting it from its losses. The evolution of life insurance traces each piece back to the problem it was added to fix.
An IUL policy is built primarily as a protective insurance structure—one designed to offer peace of mind by guaranteeing your cash value won't decline during market downturns. However, its unbundled nature provides significant flexibility, which comes with a key tradeoff: if your cash value isn't sufficient to cover policy charges, you risk letting the policy lapse.
The crediting mechanisms (caps, floors, participation rates, and spreads) are engineered so that both you and the insurer navigate market fluctuations together without either side absorbing total loss. In addition, in case of more severe downturns, the "guaranteed" rates act as another safety lever for the insurer to manage risks, though the extent to which they may do so still remains subject to state-level insurance regulations.
A Key Nuance on Cash Value Guarantees
Stating that "your cash value will not drop" is a slight oversimplification. During a severe market downturn when your annual credited interest rate hits 0%, your account value can still decline due to ongoing policy fees and mortality charges. However, in a well-structured policy held past the 10-year mark, these annual charges often drop below 1%. As long as index growth exceeds that threshold over time, the net value stays protected.
Caveat within caveat: If market conditions remain depressed for an extended period, insurers reserve the right to adjust crediting parameters as well as other charges up to the guaranteed level (all outlined in your illustration), which can further impact net returns.
Whether this downside protection is worth the tradeoff depends on several interconnected variables: your age, health status, long-term financial goals, policy terms, and market performance over the coming decades. Under certain market conditions, you may sacrifice up to half of your upside potential for that almost guaranteed floor. Furthermore, poorly designed crediting strategies can result in long-term performance that trails a straightforward market index investment across all major historical scenarios.
Have your own illustration read
Upload your policy today to receive a complimentary, objective analysis on how to choose a good crediting strategy, and what your downside protection is actually costing you.
For the easiest experience, complete your analysis on a computer.
Drop your illustration here
or click to choose a PDF, up to 25MB
3. Can an IUL lapse if you pay less?
Yes. An IUL lets you change how much and when you pay, but if the cash value can't cover the policy's charges, the policy can lapse.
Whole Life mandates strict, unchangeable premium payments. IUL permits flexible premiums: policyholders can adjust their payment timing and amounts within structural guidelines set by tax law and policy limits.
While flexibility allows policyholders to tailor funding to their financial cash flow, it introduces substantial risk if undermanaged.
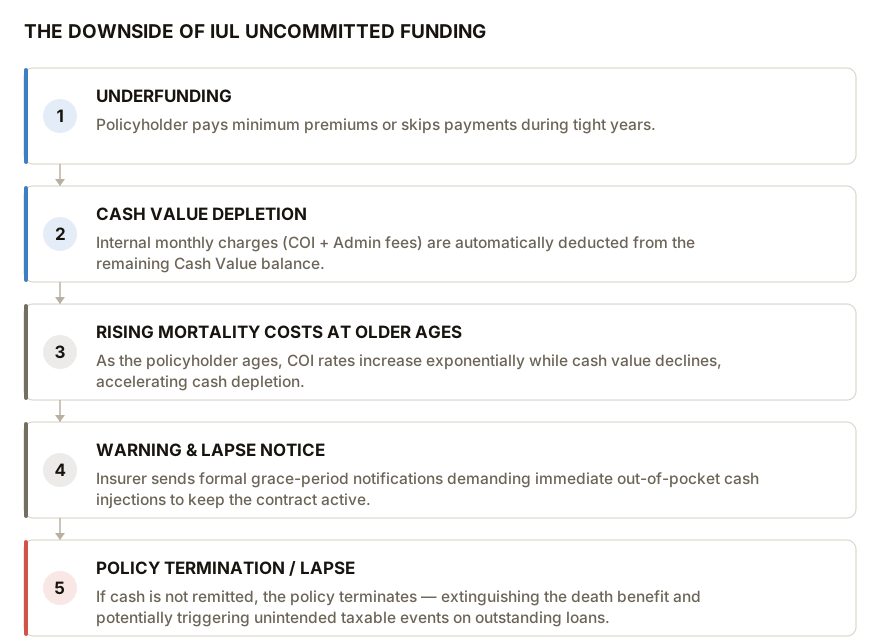
Step three is what drives the rest of the chain. The cost of insurance is not flat — it climbs with age, steeply, and late. On the 2017 CSO table, a 30-year-old male nonsmoker costs $0.16 a year per $1,000 of coverage. At 80 the same $1,000 costs $37.38, which is 234 times as much. A policy that was comfortably funded at 45 can be draining itself at 75 on the same premium.
4. Policy Design Strategies: Minimum Protection vs. Maximum Accumulation
Because IUL is an unbundled contract, it can be engineered in two diametrically opposed ways depending on the policyholder's goals:
Minimum Death Benefit Protection Design (Low Funding)
- Objective: Maximize death benefit coverage while keeping out-of-pocket costs as low as possible.
- Mechanism: The policy is structured with a large face amount (e.g., $1,000,000) and funded with only enough premium to cover internal costs of insurance and administrative fees.
- Trade-Off: Cash value accumulation is very low. If index crediting rates underperform over an extended period, the policy becomes vulnerable to underfunding and may require higher payments later in life to prevent a lapse.
Maximum Cash Value Accumulation Design (Overfunding / 7-Pay)
- Objective: Maximize cash value growth and tax-advantaged income potential rather than death benefit size.
- Mechanism: Under U.S. tax law (Internal Revenue Code Section 7702 and the Modified Endowment Contract / MEC rules), there is an upper limit to how much cash can be stuffed into a policy relative to its death benefit over a 7-year testing window (known as the 7-Pay Test). In a max-funded design, the death benefit is squeezed down to the lowest legal limit, and premiums are paid at or near the 7-pay maximum for 4 to 10 years.
- Trade-Off: Requires significant up-front cash commitment, but it rapidly builds cash value equity early on. This creates a large reserve that generates compounded interest and shields the policy from rising internal mortality costs as the owner ages.
Have your own illustration read
Drop the PDF in and we will pull out its own cap, floor, participation rate and spread, run them against every market we test, and show you what the charges took on the way.
For the easiest experience, complete your analysis on a computer.
Drop your illustration here
or click to choose a PDF, up to 25MB